When it comes to analytics, the world of social and digital marketing can be wide and expansive, and it can be difficult to figure out what to focus on—which can mean valuable time, wasted.
Aligning digital metrics with business metrics
How does your company make money? And how can social/digital marketing further these efforts? Companies fall into two broad categories, each with respective business metrics: 1) consumer companies with measurable clicks through ecommerce efforts; and 2) B2B companies that operate in a regulated space, where simply downloading a white paper can be considered a conversion. Determining which metrics to track, in alignment with business outcomes, helps marketers form longitudinal insights and give perspective into which efforts are moving the needle.
Using a scalable infrastructure
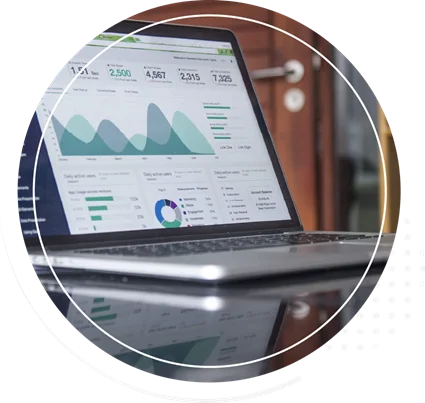
Your infrastructure can take a few different forms, from standardized dashboards or a set of standardized graphs in Excel or PowerPoint, to custom Google Analytics reports, or something like a Sprinklr dashboard—the most powerful social media management software available to marketers. Regardless of which tool or methodology you choose, the goal should be to put in place a process ensuring new metrics can be visualized quickly. In short, standardized reports + standardized metrics = getting to the bottom of what, why, and how as quickly as possible.
There are two types of standardized dashboards to consider:
- Campaign recap dashboard: showing performance of your concerted marketing effort
- Marketing program dashboard. If you’re not running a campaign, how is your evergreen (or non-campaign) content, performing? This is a place to visualize the cumulative impact of your evergreen efforts and your campaigns.
If you’re investing in social listening, consider a brand health dashboard to understand your company’s reputation volume overview. Are people talking more—or less—about your brand on social media? Is your brand experiencing a halo effect (or earned media value during a campaign versus your standard brand sentiment) from a recent campaign?
How to interpret streamlined data in a scalable infrastructure:
- Look for contradictions in data. Maybe you stopped running an ad meant to drive website traffic: while website sessions decreased, returning users increased.
- Did your digital metrics, tied to business outcomes, increase or decrease? How does that compare to your budget, to calculate cost-per metrics, like cost-per-click, cost-per-engagement, or cost-per-conversion? These metrics help determine the efficiency of an ad, especially when compared to industry benchmarks.
Answering these questions will help frame your outcomes and give overall perspective to the campaign, enabling you to contextualize the data and more easily inform future campaigns.
Looking for assistance with your analytics? Contact us here for more information.


